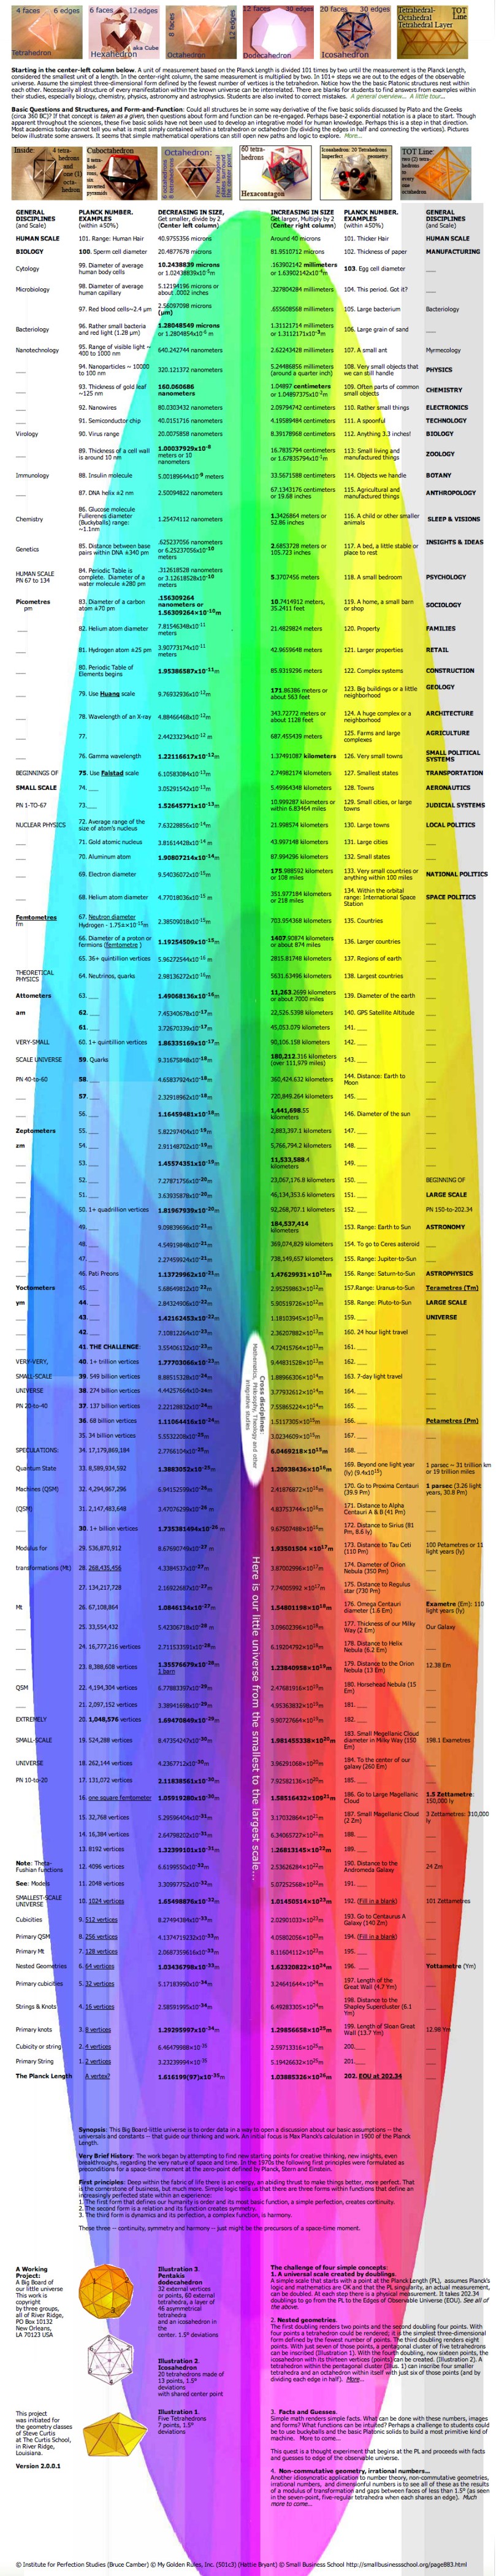
The very first chart used in a classroom on December 19, 2011 in New Orleans.
The actual chart is 60″x 11″ so you can use your CMD + to increase the size of this image so the data is more readable. An online alphanumeric chart is here.
The very first chart used in a classroom on December 19, 2011 in New Orleans.
The actual chart is 60″x 11″ so you can use your CMD + to increase the size of this image so the data is more readable. An online alphanumeric chart is here.
